
Your P&L — three views, always current
The Cash Basis / Accrual Income Statement gives you three fully interactive profit-and-loss views of your Sage data in one dashboard — Accrual, Cash Basis, and a side-by-side Cash vs Accrual comparison. Answer questions from your controller, your CPA, and your bonding agent without running separate reports. Toggle between tabs, select any date range, and instantly see revenue, gross margin, and net income.
Tab 1: Accrual Income Statement
Revenue and expenses recognized when earned or incurred — the standard view for GAAP financial statements, bonding packages, and bank covenants.
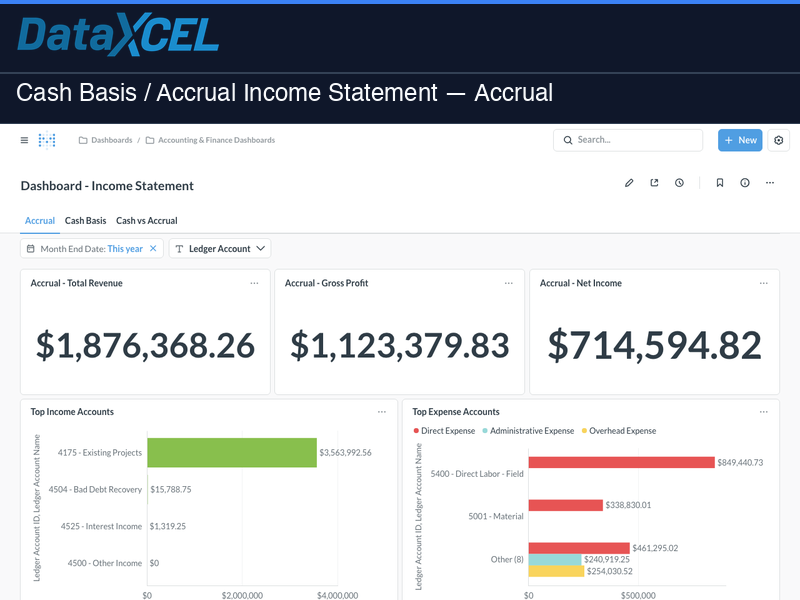
- Total Revenue, Gross Profit, Net Income — three KPI scorecards updated in real time
- Top Income Accounts — bar chart ranking your highest-revenue GL accounts
- Top Expense Accounts — bar chart breaking down direct, administrative, and overhead expenses
- Monthly Trend — revenue by month line chart for spotting seasonal patterns
- Full Income Statement — structured P&L table with account hierarchy (Revenue → COGS → Gross Profit → Operating Expenses → Net Income)
Tab 2: Cash Basis Income Statement
Revenue and expenses recognized when cash changes hands — the view your CPA needs for tax preparation and the view owners use to understand actual cash flow.
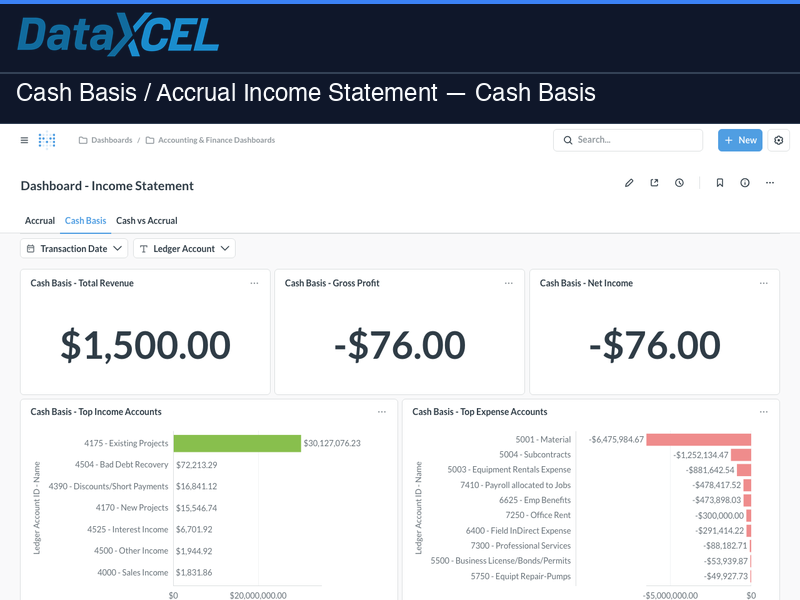
- Cash Basis KPIs — Total Revenue, Gross Profit, and Net Income on a cash basis
- Top Income & Expense Accounts — same bar chart layout as Accrual but reflecting cash transactions only
- Monthly Cash Trend — cash revenue by month for tracking collection patterns
- Full Cash Basis P&L — structured table matching the Accrual layout for easy comparison
Tab 3: Cash vs Accrual Comparison
The comparison tab puts both methods side by side — six KPI scorecards and three overlay line charts showing where accrual and cash diverge over time.
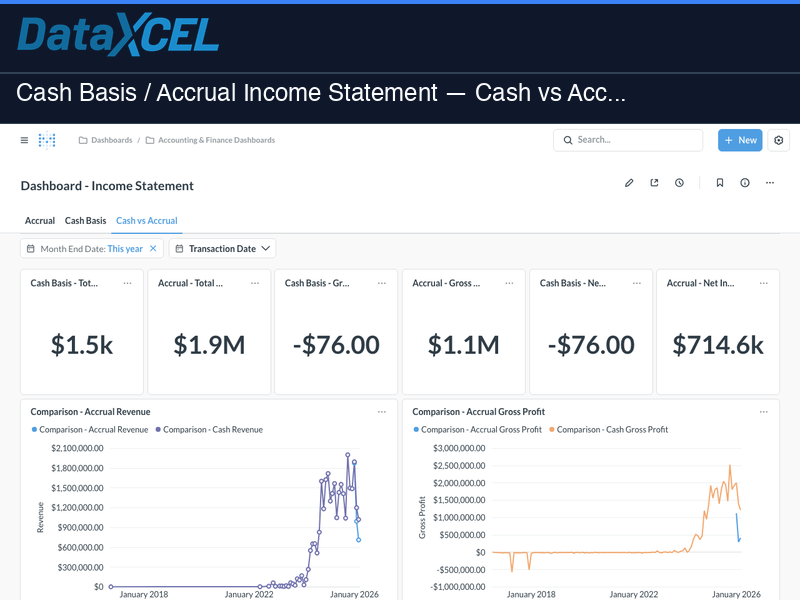
- Six KPI Scorecards — Cash Revenue vs Accrual Revenue, Cash Gross Profit vs Accrual Gross Profit, Cash Net Income vs Accrual Net Income
- Revenue Comparison Chart — monthly overlay line chart showing accrual revenue (primary) and cash revenue (secondary)
- Gross Profit Comparison Chart — monthly overlay showing how gross margin differs between methods
- Net Income Comparison Chart — full-width monthly overlay revealing the timing gap between accrual and cash profit
Interactive filters
Month End Date • Transaction Date • Ledger Account — applied consistently across all three tabs.
Who it’s for
- CFOs and Controllers — close the month faster with a live P&L that updates the moment transactions post in Sage
- Owners — compare accrual and cash profit side by side to understand both the GAAP picture and the cash reality
- CPAs and Bookkeepers — pull the income statement in either basis without requesting a Sage login
- Bonding Agents — share a clean, current Accrual P&L from a live link instead of a stale PDF export
⚠️ Requires a DataXcel Subscription — choose the plan that fits your team:
Explorer — $200/mo
1 user • data warehouse access • buy reports à la carte • 3 training sessions
View Explorer →Get It All — $799/mo
20 users • all 61 dashboards ($17,580 value) included • unlimited access
View Get It All →Both plans require a one-time $2,500 onboarding & setup fee.
📊 Try it live — no login required
Explore a live demo of this dashboard using real sample data. Filters, charts, and drilldowns all work — no account needed.
🔗 Open Live Demo →